
Reading the Dashboard
The Dashboard answers “how is the business doing?“ for any time window.
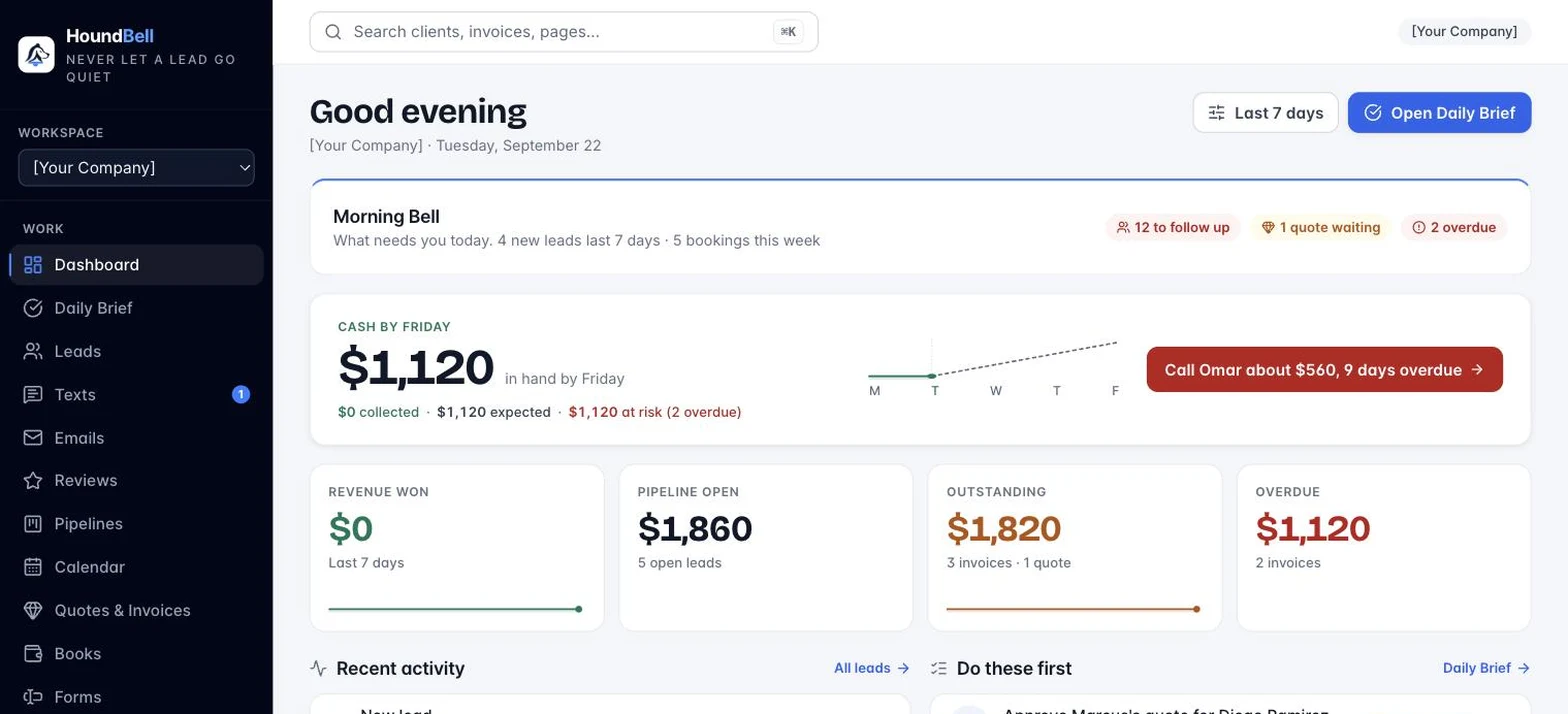
- The time selector in the top right (Last 7 days by default) controls the whole page. It offers Last 7, 30, 60, and 90 days, This quarter, Year to date, Last 12 months, All time, and Custom range with your own from and to dates.
- Leads and Total leads (all time) count new inquiries.
- Revenue won counts the value of leads that entered a Won stage during the selected window. Revenue belongs to the day you won the deal, not the day the lead arrived.
- Pipeline potential (open leads) totals the value of every open deal, regardless of date. It is a “right now“ snapshot of money on the table.
- The Revenue won chart shows revenue per day. The comparison dropdown overlays the previous period or the same period last year. Click any bar to see exactly which sales make up that day, and click a sale to open the lead.
- Revenue by Service breaks the window’s revenue down by what you sold, showing your top 5 with the active date range in the panel header. View a breakdown of all services at the bottom opens the full Services page: every service with won revenue, jobs won, average job value, share of revenue, open leads, and pipeline potential, filterable by date range and exportable to CSV. Click any service there to see the individual sales behind the number.
- Leads lists the newest leads in the window; click one to open its full card.
—
Still stuck?
Email us and a person will answer. Include your workspace name, and the quote or invoice number if it is about one.
Email support@houndbell.com